
Use the Performance report to see what share of interactions has a recorded conversion, how long conversion took for those without an explicit AI escalation, and what share was escalated to a person.
Open it from the Performance report card under Business Performance on the Dashboard.
How this report counts results
The report’s rates group interaction records by their start date, not by unique customer. An interaction can exist without an associated conversation. A conversion or escalation recorded later is assigned to the date that interaction started.
For example: Interaction started April 7 → AI escalated it April 8 → A conversion was recorded April 10. That interaction can count in the conversion and escalation rates for April 7. Because it was escalated, it does not enter the visible Time to conversion average.
Conversion rate and Escalation rate divide their respective counts by all interactions started in the period. Time to conversion uses a narrower population: converted interactions without an explicit AI escalation. The series and breakdowns do not always show the same measure as the headline card; read each view according to its calculation.
Recent dates can change when later conversions or escalations are recorded for interactions that already started. Compare cohorts of the same age before attributing a recent drop to a performance change.
Read the main metrics
Select a metric to update the timeline and available breakdowns.
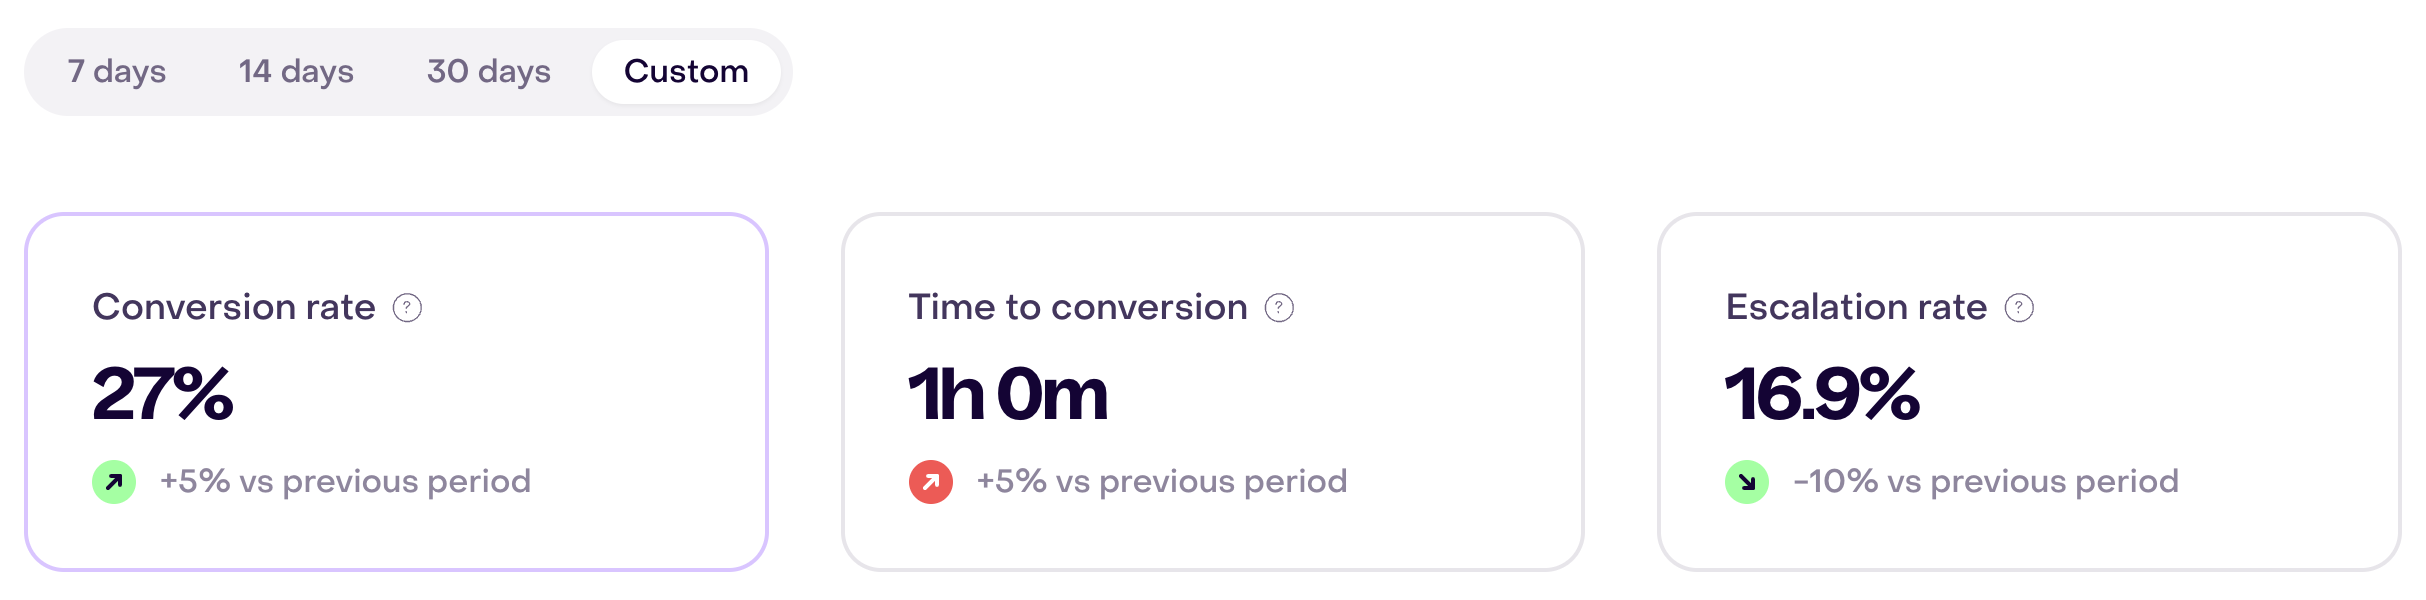
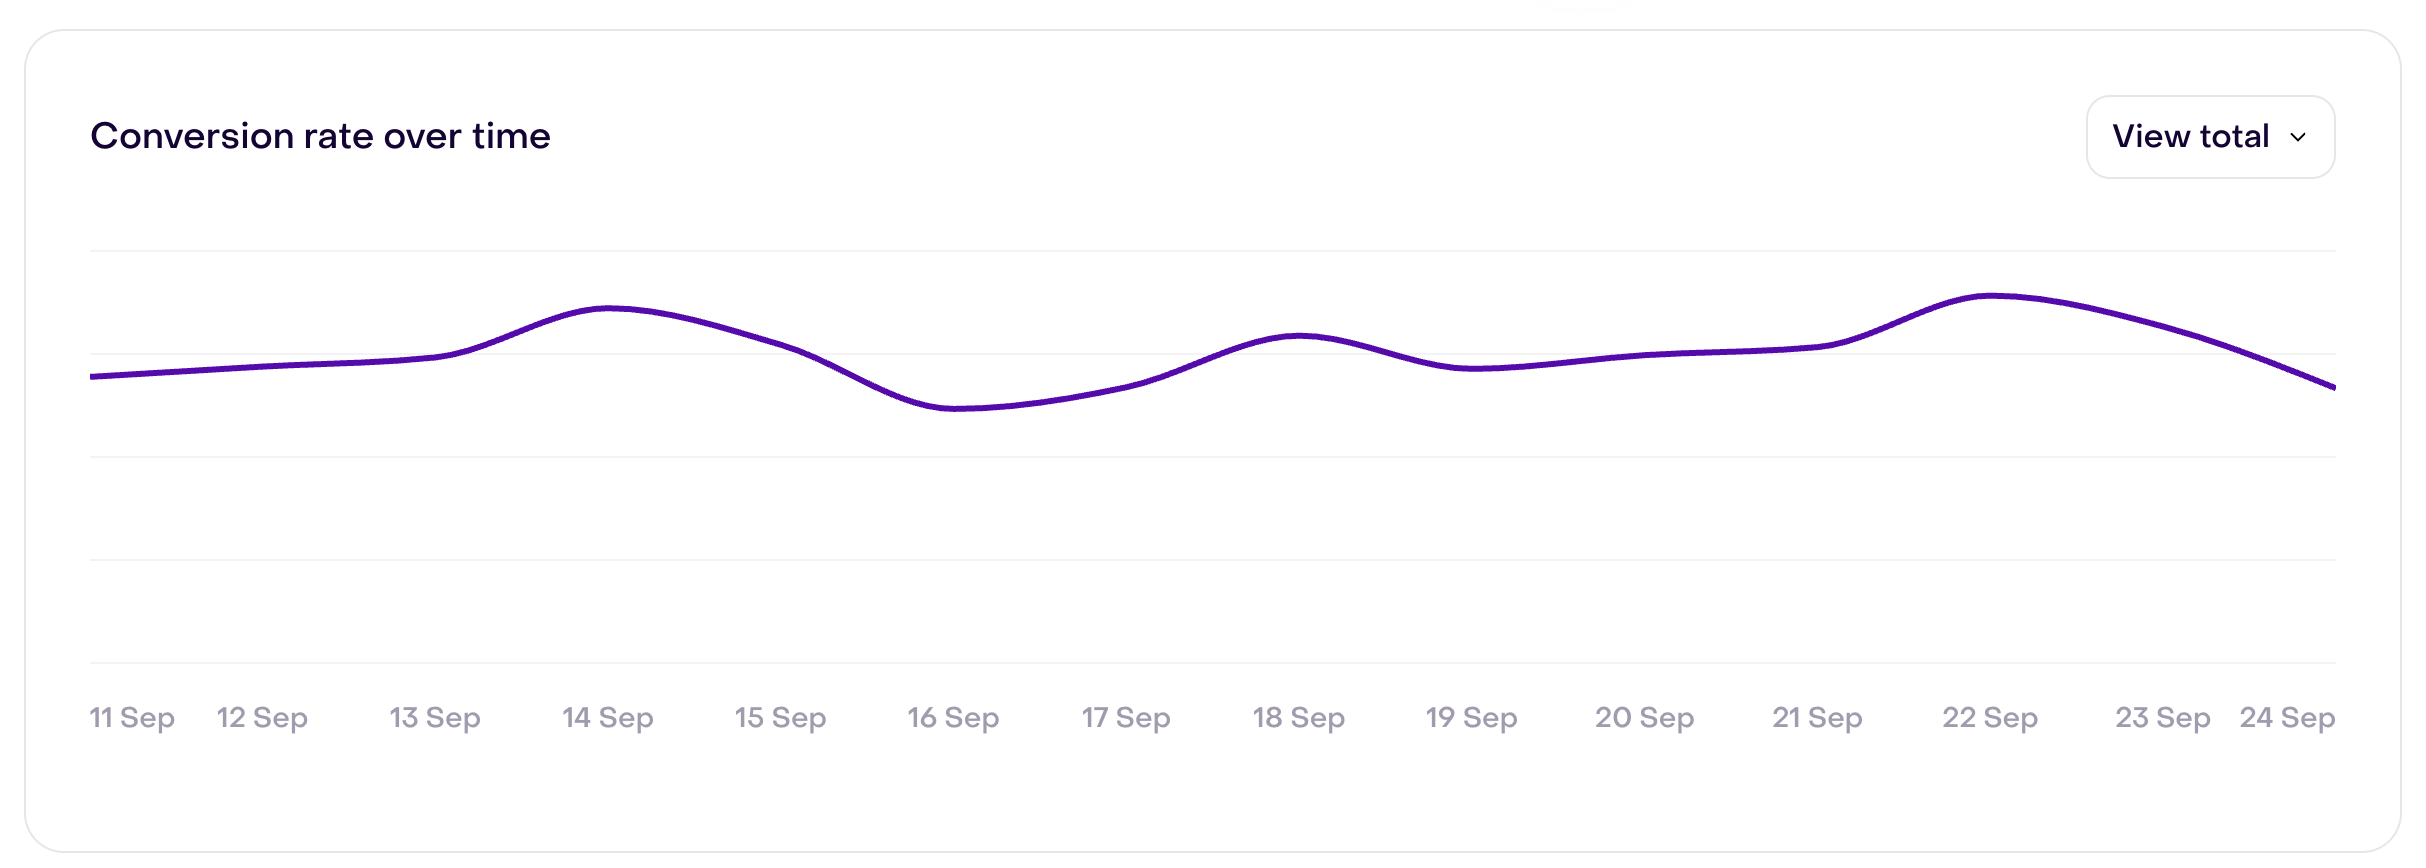
In this example with demonstration data, Conversion rate is selected for a custom period. All three cards use that period; the line shows how conversion varies by interaction start date.
Conversion rate
The percentage of interactions started in the period that have a recorded conversion. The numerator counts those converted interactions; the denominator includes all interactions started in the period.
A conversion can come from an attributed purchase or a goal recorded manually by a teammate. If it is recorded later, it can raise the rate for the earlier date when the interaction started.
This rate is neither the whole store’s purchase rate nor a count of unique customers. Use the Revenue report when you need purchases and revenue by purchase date.
Time to conversion
The visible headline shows the average time from start to recorded conversion among converted interactions without an explicit AI escalation. The report calculates a separate average for escalated interactions, but that second value is not shown in the card or main series.
A person may have participated in an interaction without an escalation, so this is not necessarily AI-only work. A lower value means faster conversions within that population; by itself it does not prove a better experience. If there were no eligible conversions, a zero value does not prove an instant conversion either.
Escalation rate
The percentage of interactions started in the period for which AI explicitly requested a human takeover. The numerator counts interactions with a recorded escalation; the denominator includes all interactions started in the period.
Human participation alone does not count as an escalation. A teammate can reply, claim ownership, or help during a conversation without changing this metric when AI did not request the handoff.
An escalation is not automatically a failure. Review the interaction and its rules before deciding whether the handoff was appropriate.
Read AI handoff to Inbox for the available handoff paths.
Use the breakdowns
The offered breakdowns depend on the selected metric. Where a calculation is implemented, the chart shows counts: converted interactions for Conversion rate and Time to conversion, or escalated interactions for Escalation rate. Those values are not a per-category rate or average duration.
The selector offers these options for Conversion rate and Time to conversion:
- channel;
- Playbook;
- Campaign; or
- AI versus human.
For Escalation rate, the selector offers:
- channel;
- Playbook;
- Campaign;
- reason;
- team;
- teammate; or
- AI agent.
The AI versus human breakdown classifies by links to a Campaign or automation workflow and, in other cases, by an associated teammate; it does not split interactions by whether an escalation occurred. Do not compare it directly with the two duration charts. To calculate a rate for a channel or Playbook, you also need the total number of interactions started in that category.
The reason, team, and AI agent options appear for Escalation rate but have no breakdown calculation in this report. A blank result there does not show that no escalation occurred. Teammate can show the count of escalated interactions associated with a person; unassigned interactions do not appear in that group.
Understand the duration charts
Below Time to conversion, the AI-Only and Team-managed charts group interactions by an assigned duration interval from their start to the event that closed them. They include interactions closed without a conversion, so they are not a distribution of sales or completed goals alone.
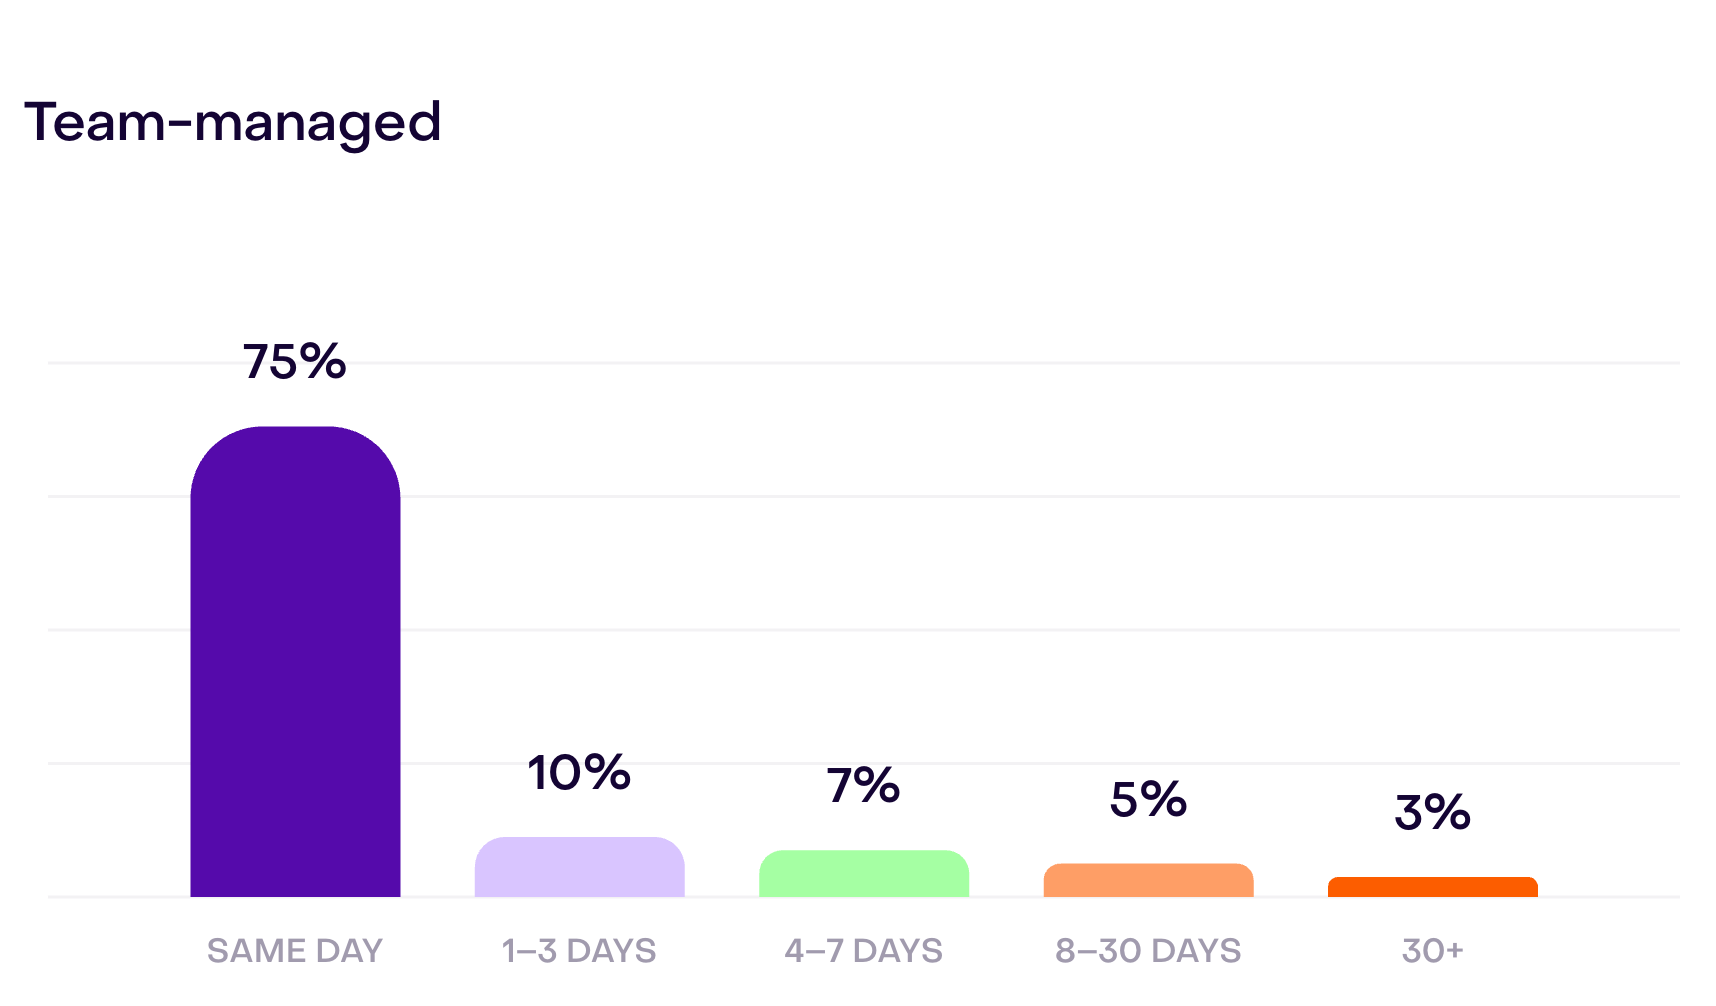
In another custom period, the Team-managed chart shows all five duration intervals. Each percentage is calculated within that group of interactions. In this fictional data, 75% lasted less than 24 hours; the remainder is spread across the other four intervals.
- AI-Only: there was no explicit AI escalation. A teammate may still have participated without a recorded handoff.
- Team-managed: AI recorded an escalation, whether or not a conversion followed.
Each chart shows the count and share within its own group for the intervals the interface calls:
- the same day;
- in 1–3 days;
- in 4–7 days;
- in 8–30 days; or
- in 30 days or more.
In this calculation, “same day” means less than 24 hours elapsed, not necessarily the same calendar date. The interval is fixed when the interaction ends; a conversion recorded later does not recalculate it. Do not treat these charts as a breakdown of the Time to conversion average, which includes only converted interactions without an escalation.
Compare Performance with other reports
Use the report whose date basis answers your question:
| Question | Report |
|---|---|
| What conversions and escalations were recorded for interactions started in this period? | Performance report |
| How much revenue was recorded from purchases in this period? | Revenue report |
| How did a Playbook perform under each of its metrics? | Playbook report |
| What deliveries, clicks, and attributed purchases occurred in this period? | Campaign report |
| How were conversations resolved and did they meet SLA? | Service quality report |
Performance groups by interaction start date; Revenue groups by purchase date. Campaign detail counts each event on its own date, including an attributed purchase on the purchase date. Playbook reports combine event-date metrics with some revenue and conversion metrics grouped by the credited source-message date. Check each metric’s rule before comparing periods.
Turn the report into an action
| If you see… | Review… |
|---|---|
| Conversion rate falling | Whether recorded conversions are missing, whether the volume of started interactions changed, and what source records show. A channel count is not a channel rate. |
| Time to conversion increasing | Converted interactions without an escalation and their start and conversion times. The duration charts also include closures without conversion. |
| Escalation rate increasing | Representative interactions, handoff rules, and Playbook or channel context. A blank reason or team breakdown is not proof of zero. |
| One Playbook shows more conversions | Its total interaction volume before concluding that its conversion rate rose. |
| One teammate appears in many escalations | Assignments and team capacity in operational reports before attributing all workload to that person. |
| Recent conversion looks lower | Whether the cohorts being compared have had equal time to record outcomes. |
Open representative interactions and conversations before changing a Playbook, prompt, knowledge source, routing rule, or team destination. The report points to a pattern; source records help explain the cause.
When data is missing or unexpected
Confirm that:
- interaction starts are recorded with the correct timestamp;
- conversion is recorded on the interaction, whether through an attributed purchase or a manually logged goal;
- explicit AI handoffs have a recorded escalation event; human participation without one does not change the rate;
- channel, Playbook, Campaign, or teammate context is present for the breakdown you want to read; and
- both comparisons use the same date range, timezone, and metric, while accounting for whether you compare a card, series, or breakdown count.
If a purchase appears in Revenue but not as a conversion in Performance, check whether it was linked to a recorded interaction; the two reports do not use the same population. If the Time to conversion card and series differ near the range’s last day, check the dates of interactions without an escalation before drawing a conclusion. If the source records exist but the report remains inconsistent, follow Data completeness and reporting gaps.